 Grass-fed beef, fatty fish, organ meats… some animal foods get an easy green light when it comes to eating Paleo. But, another major animal food group tends to be less frequently discussed: poultry! Domesticated fowl like chicken and turkey are favored in mainstream nutrition due to being relatively lean and low in calories, but for those of us who don’t fear natural animal fats, other meats may be more popular choices (hello, sizzling rib-eye!). One reason for that is definitely flavor (skinless chicken breast isn’t known to make most people salivate), but another has to do with poultry’s reputation for being nutritionally inferior to other meat sources (especially its relative abundance of omega-6 fats). So, do birds deserve a prominent place on our menus? Let’s take a look at what poultry can and can’t offer us!
Omega-6
One of the most legitimate concerns with poultry involves its fatty acid profile. Poultry is the richest source of omega-6 out of any animal food: conventional chicken fat is almost 20% omega-6 as a percent of total energy, which is more than canola oil (19% omega-6) and not too far behind peanut butter (22.5%)! In fact, chicken contributes an average of 13% of the omega-6 content to the average American diet! (For a refresher on why we don’t want astronomical omega-6 intakes, check out “What About Fat?” and “Why Vegetable Oils are Bad”)
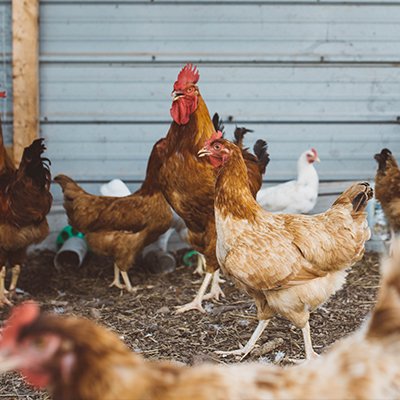
 And, simply giving poultry access to the outdoors (which allows the meat to be labeled free-range) isn’t always enough to turn the fatty acid tables. Research focusing on the effects of different poultry farming methods (caged versus free-range) and diets (conventional, organic, or pasture access) have had mixed results, and suggest the labeling we associate with higher-quality chicken doesn’t guarantee a better fatty acid profile for the bird. Some studies of cereal-fed chickens with or without access to pasture show no difference in the omega-6/omega-3 ratio, unless the birds have their intake of cereal grains deliberately restricted (which sometimes increases their levels of the omega-3 fats eicosapentaenoic acid, docosapentaenoic acid, and docosahexaenoic acid). Likewise, chickens that pasture-graze in the spring (but not other seasons!) tend to have higher levels of omega-3 fats in their meat. And, some studies of free-range versus conventional chickens have shown that free-range breast and thigh meat have a higher omega-6/omega-3 ratio than the same meat from conventionally raised chickens!
What does seem to make a difference isn’t so much the “free range” or “conventional” distinction, but other particulars of the birds’ diets. One report by the American Pastured Poultry Producers Association found that among pastured chickens, those that were fed soy-containing diets had an omega 6/3 ratio of 8 to 1, while those fed soy-free diets had a much-improved ratio of only 3 to 1. (For comparison, a chicken labeled “organic free-range” had a ratio of 11.6 to 1, and a chicken labeled “non-organic free range” had a ratio of 11.3 to 1.) Studies of turkey have shown similar omega 6/3 patterns related to diet and forage access.
Unfortunately, that level of dietary detail isn’t usually available on meat labels at the store (though befriending the local poultry vendor at the farmers market is one way to get the scoop!). But, here’s the good news: reducing our omega-6 content from poultry doesn’t require knowing every detail of the bird’s life. In general, leaner meat (particularly breast) is going to have less omega-6 than fattier poultry parts (like legs and wings), and the skin—even though it’s pretty delicious!—is a highly concentrated fat source. Choosing lean poultry and removing the skin will automatically reduce our omega-6 intake, regardless of how the birds were raised and fed.
Micronutrient Breakdown
 Apart from fatty acid content, how does poultry measure up to other meat sources on the micronutrient front? Although the exact nutritional profile depends on the specific cut of poultry meat, which bird we’re eating (chicken, turkey, duck, geese, pheasant, and so forth all have slightly different nutritional profiles), and what the birds were fed, we can still get a ballpark idea by comparing poultry to other meat of similar quality. For example, let’s look at 100 g of conventional chicken breast and 100 g of conventional top round beef:
- Niacin: 69% of the DV in chicken, 19% of the DV in beef
- Vitamin B6: 30% of the DV in chicken, 14% of the DV in beef
- Pantothenic acid: 10% of the DV in chicken, 4% of the DV in beef
- Riboflavin: 7% of the DV in chicken, 15% of the DV in beef
- Thiamin: 5% of the DV in chicken, 5% of the DV in beef
- Iron: 6% of the DV in chicken, 18% of the DV in beef
- Magnesium: 7% of the DV in chicken, 6% of the DV in beef
- Phosphorus: 23% of the DV in chicken, 23% of the DV in beef
- Potassium: 7% of the DV in chicken, 10% of the DV in beef
- Zinc: 7% of the DV in chicken, 30% of the DV in beef
- Copper: 2% of the DV in chicken, 6% of the DV in beef
- Vitamin B12: 6% of the DV in chicken, 45% of the DV in beef
- Selenium: 39% of the DV in chicken, 47% of the DV in beef
Graphically, here’s what these numbers look like:
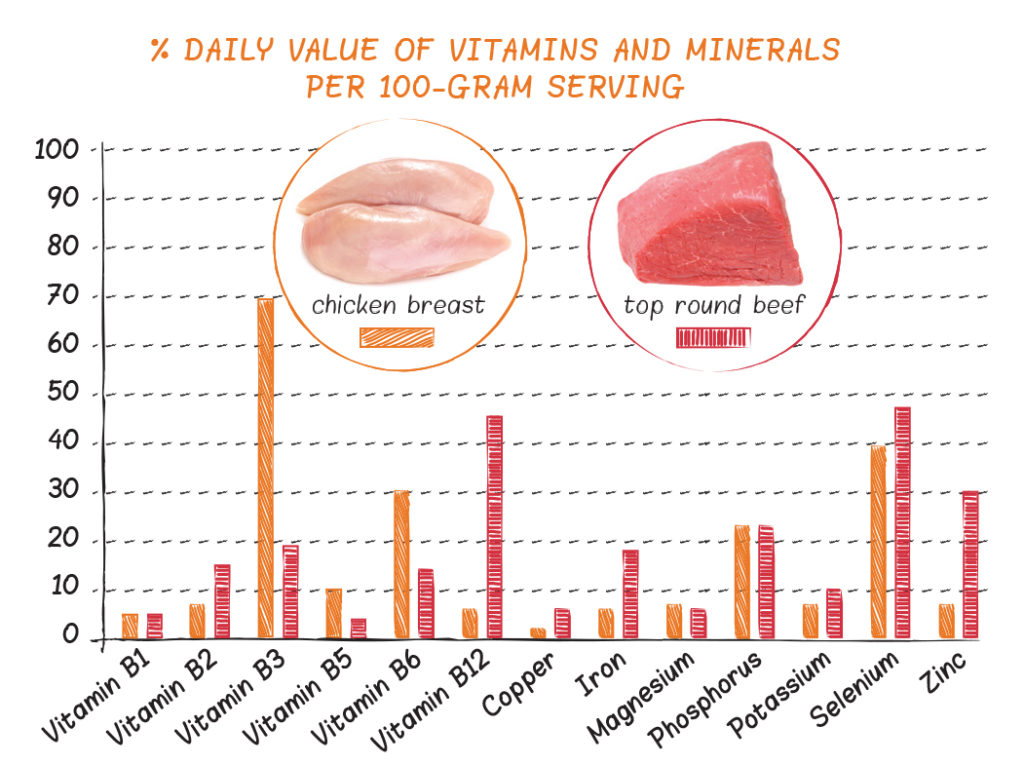
As we can see, beef is the clear winner when it comes to iron, zinc, and vitamin B12, but chicken actually comes out ahead for niacin and vitamin B6, and many of the other nutrients are comparable between these two meat sources. But, what about other meats? Here’s chicken side-by-side with another Paleo favorite, pork chops!
- Niacin: 69% of the DV in chicken, 45% of the DV in pork
- Vitamin B6: 30% of the DV in chicken, 33% of the DV in pork
- Pantothenic acid: 10% of the DV in chicken, 6% of the DV in pork
- Riboflavin: 7% of the DV in chicken, 11% of the DV in pork
- Thiamin: 5% of the DV in chicken, 35% of the DV in pork
- Iron: 6% of the DV in chicken, 3% of the DV in pork
- Magnesium: 7% of the DV in chicken, 6% of the DV in pork
- Phosphorus: 23% of the DV in chicken, 31% of the DV in pork
- Potassium: 7% of the DV in chicken, 15% of the DV in pork
- Zinc: 7% of the DV in chicken, 11% of the DV in pork
- Copper: 2% of the DV in chicken, 3% of the DV in pork
- Vitamin B12: 6% of the DV in chicken, 8% of the DV in pork
- Selenium: 39% of the DV in chicken, 66% of the DV in pork
Again, graphically, here’s what these numbers look like:
Nutrivore Weekly Serving Matrix
An easy-to-use and flexible weekly checklist
to help you maximize nutrient-density.
The Weekly Serving Matrix is very helpful! I’ve been eating along these lines but this really helps me know where to focus vs. which foods serve a more secondary role. It’s super helpful and has taken a lot of worry out of my meal planning. Thanks!
Jan
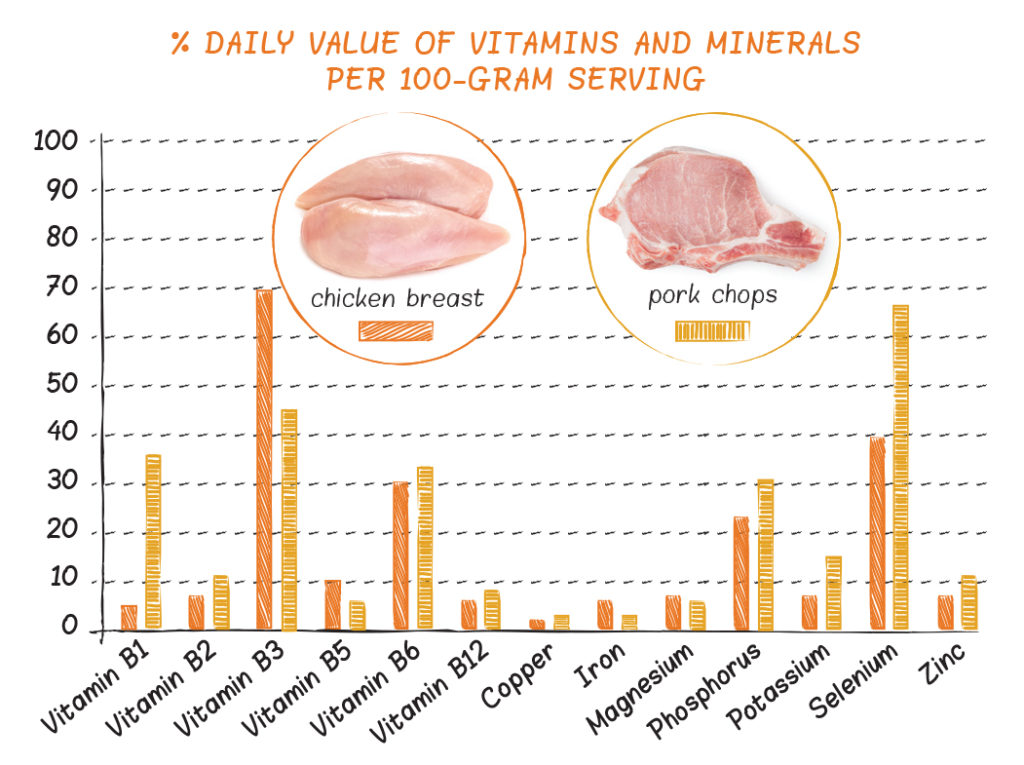
Pork is a much better source of selenium and thiamin, but chicken wins for niacin, and is relatively neck-and-neck with pork for most other nutrients.
So, we can safely say that when it comes to vitamins and minerals, chicken (and poultry in general) is far from empty calories! In particular, poultry’s high concentration of niacin can assist with energy production (as well as digestive, skin, and nervous system health); its vitamin B6 content helps the body manufacture neurotransmitters; its phosphorus plays a big role in skeletal health; and its selenium helps maintain thyroid function and protect against free radical damage. Not too shabby!
Other Benefits
 Along with its vitamin and mineral contributions, poultry is a fantastic source of complete protein. (To see why complete animal protein totally rocks, see “Link to Plant-Based Protein post”). One cup of cooked skinless chicken breast provides a whopping 43 grams of protein! As a result, poultry may help regulate appetite, improve body composition, enhance thermogenesis (fat burning), reduce bone loss and improve bone density, improve blood sugar control, assist with wound healing (see “Nutritional Support for Injury and Wound Healing”), and offer other benefits that come from increasing our intake of high-quality protein. And, for people with iron storage disorders (like genetic hemochromatosis), poultry is great for providing animal-based nutrients without the hefty iron content of red meat.
Poultry is More Than Just Thigh, Breast, and Wing!
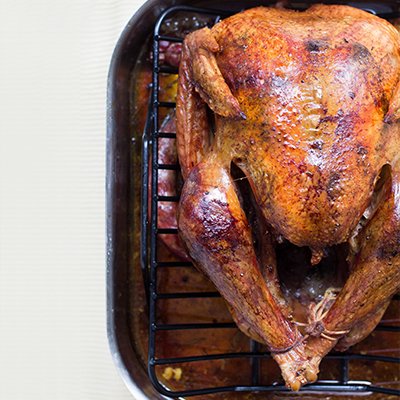
 On top of poultry muscle meat, birds have some other incredible, nutrient-dense parts that we should incorporate into our diets! Poultry livers are micronutrient goldmines (not to mention, more mildly flavored than beef liver and easier for some people to enjoy) that are packed with vitamin B12, vitamin A, folate, niacin, riboflavin, pantothenic acid, and selenium. Poultry feet, necks, and bones provide connective tissue that can lead to super gelatinous broth, rich in glycine and proline (see “Why Broth is Awesome”). The more of the bird we can eat, the more we’ll benefit!
Making the Best Choices
Overall, there’s no reason to avoid poultry! It’s a great way to diversify an omnivorous diet and enhance the quantity and scope of our micronutrient intake. But, we also shouldn’t rely exclusively on poultry to meet our animal food needs. Consuming plenty of omega-3-rich seafood (like salmon and mackerel) can help balance out any excess omega-6 we get from poultry, and most of us could benefit from the iron and zinc found in higher concentrations in other animal products (like beef and shellfish). Bottom line, we can definitely enjoy poultry as part of a varied and delicious Paleo diet!
Citations
Badger M. “Pasture and Feed Affect Broiler Carcass Nutrition.” American Pastured Poultry Producers Association (APPPA). 22 Apr 2015.
Chen X, et al. “Effects of outdoor access on growth performance, carcass composition, and meat characteristics of broiler chickens.” Poult Sci. 2013 Feb;92(2):435-43.
Funaro A, et al. “Comparison of meat quality characteristics and oxidative stability between conventional and free-range chickens.” Poult Sci. 2014 Jun;93(6):1511-22.
Halton TL & Hu FB. “The effects of high protein diets on thermogenesis, satiety and weight loss: a critical review.” J Am Coll Nutr. 2004 Oct;23(5):373-85.
Hannan MT, et al. “Effect of dietary protein on bone loss in elderly men and women: the Framingham Osteoporosis Study.” J Bone Miner Res. 2000 Dec;15(12):2504-12.
Mikkelsen PB, et al. “Effect of fat-reduced diets on 24-h energy expenditure: comparisons between animal protein, vegetable protein, and carbohydrate.” Am J Clin Nutr. 2000 Nov;72(5):1135-41.
Pannemans DL, et al. “Effect of protein source and quantity on protein metabolism in elderly women.” Am J Clin Nutr. 1998 Dec;68(6):1228-35.
Ponte PI, et al. “Influence of pasture intake on the fatty acid composition, and cholesterol, tocopherols, and tocotrienols content in meat from free-range broilers.” Poult Sci. 2008 Jan;87(1):80-8.
Ponte PI, et al. “Restricting the intake of a cereal-based feed in free-range-pastured poultry: effects on performance and meat quality.” Poult Sci. 2008 Oct;87(10):2032-42.
Sales J. “Effects of access to pasture on performance, carcass composition, and meat quality in broilers: a meta-analysis.” Poult Sci. 2014 Jun;93(6):1523-33.
Veldhorst M, et al. “Protein-induced satiety: effects and mechanisms of different proteins.” Physiol Behav. 2008 May 23;94(2):300-7.
Westerterp-Plantenga MS, et al. “High protein intake sustains weight maintenance after body weight loss in humans.” Int J Obes Relat Metab Disord. 2004 Jan;28(1):57-64.
Westerterp-Plantenga MS, et al. “Dietary protein, weight loss, and weight maintenance.” Annu Rev Nutr. 2009;29:21-41. doi: 10.1146/annurev-nutr-080508-141056.

