Table of Contents[Hide][Show]
- Defining the Term Nutrient-Dense
- The Science of Nutrient Profiling
- How Nutrient Profiling Could Inform Dietary Guidelines
- The Problem with Penalizing, Capping and Emphasizing
- Consumer-Focused Nutrient Profiling
- The Problem of Incomplete Data
- How the Nutrivore Score Is Calculated
- Using the Nutrivore Score
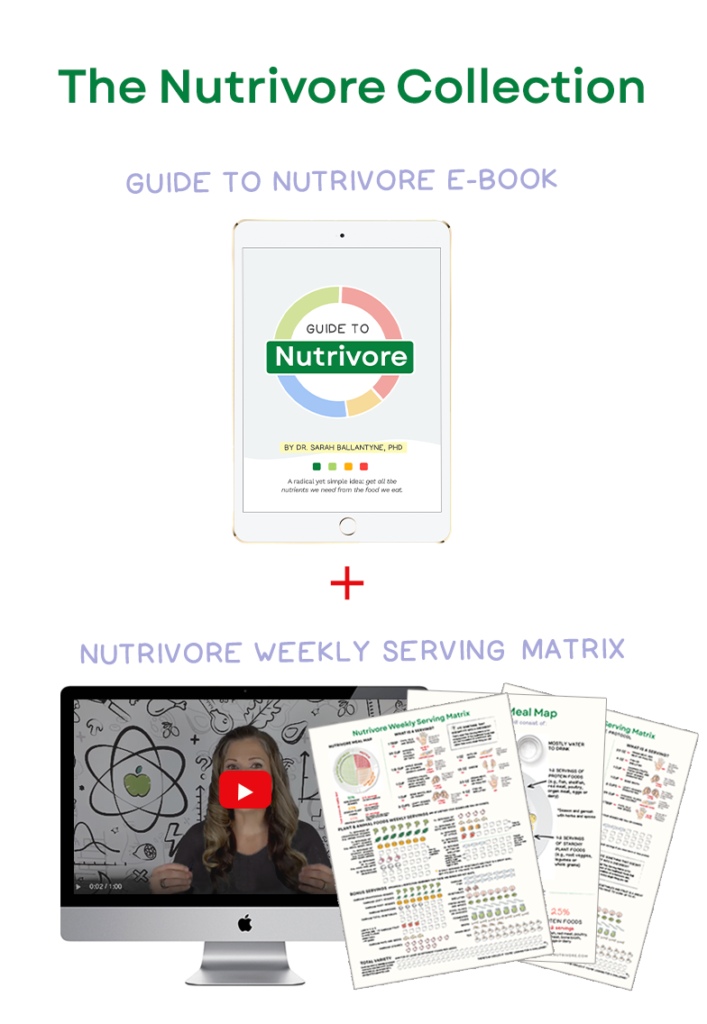
- Introducing the Guide to Nutrivore E-Book!
- Citations
I developed the Nutrivore Score to be the most comprehensive and least biased assessment of the nutrient density of individual foods. Why? When I first started developing the foundational content for Nutrivore.com a little over a year ago, I knew that I needed a method to quantify the nutrient density of foods. This is actually a field of research called nutrient profiling, the science of categorizing foods according to their nutritional composition. My initial plan was to comb through the research and choose one of the dozen or so existing nutrient density scores to use. After reading through nearly every nutrient profiling study ever published (which took me about two months!), I reached a disappointing conclusion: Every nutrient density score that had been developed thus far is flawed.
The goal of a Nutrivore diet is to fully meet the body’s nutritional needs from the foods we eat, see What Is a Nutrivore?. The most efficient way to achieve this goal is by choosing nutrient-dense superfoods as the foundational foods of our diet. But, how do we even identify which foods those are? My new Nutrivore Score is a measure of much nutrients, relative to the daily value (DV), a food contains per calorie, using 33 nutrients in its calculation.
But, before we dive into how the Nutrivore Score is calculated, let’s first discuss why it’s necessary.
Defining the Term Nutrient-Dense
Scientists have been working towards a standard method for quantifying the nutrient density of foods for about twenty years, but their efforts have been complicated by fuzzy definitions, incomplete nutrient data, lack of clarity on whether certain nutrients (or food groups) should be more or less heavily weighted in a calculation, disagreement on whether a food should be penalized for containing high levels of problematic compounds (like sodium or added sugars), and a misguided desire to retrofit a nutrient density score to align with the USDA dietary guidelines or its proxy, the Healthy Eating Index, rather than analyzing health outcomes or nutrient status test results.
The concept of a nutrient-dense food was first defined in the 1970s as any food that provided “significant amounts of essential nutrients” per serving. Because of a lack of formal criteria for determining whether or not a food met this definition, inconsistent and subjective standards were applied, largely build around broad food groups, and overly focused on fat and sugar content as problematic, rather than vitamins, minerals, and other important nutrients as beneficial. As a result, some foods were labelled as unhealthy, like nuts, olives, and avocadoes, purely because of their fat content—we now recognize all of these foods contain heart-healthy fats that reduce cardiovascular disease risk and they all have medium to high Nutrivore Scores. In addition, the terms “good source” and “excellent source” were defined as providing 10% or 20% DV, respectively, of a specific nutrient per serving—for example, if a food contained 10% DV of vitamin C, it could include the phrase “A good source of vitamin C” on its label. As a result, some foods were labeled as healthy based on being a good source of a single nutrient; for example, whole grains were promoted based on being a good source of fiber—we now know that whole grains have, on average, the lowest Nutrivore Scores of any whole food while also having high energy density, meaning you consume a whole lot of calories but relatively few essential nutrients per serving.
The Science of Nutrient Profiling
Nutrient profiling, defined as the science of categorizing foods according to their nutritional composition, began in the early 2000s with the development of several similar methods to quantify the nutritional value of foods, including (but not limited to): Nutrient for Calorie (NFC), Calorie for Nutrient (CFN), Nutritious Food Index (NFI), Naturally Nutrient Rich (NNR) Score, Nutrient-Rich Foods Index (NRF), Nutrient Adequacy Score (NAS), and Nutrient Density Score (NDS). These scores/indices differ from each other in small but meaningful ways.
Some scores calculate nutrient density as a function of food weight, which is influenced by nonnutritive compounds like water content, but most represent the nutrient density as a function of energy. Given that our food supply is overabundant in calories while being overall depleted in nutrients, the more important information for the average consumer is how to maximize nutrients for each calorie, rather than for each gram or serving of food.
Some of the scores are normalized (so for example, the range is 0 to 100 or 0 to 1000), whereas others are simply totals. The problem with normalization is communication: while it may seem simpler to represent all foods on a scale from 0 to 100, the immense difference between the nutrient density of vegetables versus, say, fast food, is minimized when the scale is smaller. Some scores also include a weighting by food group, so the most nutrient-dense grain gets allocated the score of 100 in the grains group and the most nutrient-dense vegetable gets allocated the score of 100 in the vegetables group. This food group weighting system completely undermines the entire concept of nutrient profiling. For example, the Nutrivore Score of kale is 4150 whereas the Nutrivore Score of oats is 200, but when you apply a correction for food groups, their nutrient density scores are very similar. Studies show their health benefits are not equivalent, why would be normalize their nutrient-density scores to make them appear to be equally nutritious foods when they clearly aren’t?
The other way these scores differ is in the nutrients used to make the calculations. Most include protein and fiber, but the CFN only includes protein and the NFI only includes fiber. Which vitamins are utilized in the calculations ranges from only vitamin C (in the NDS5) all the way to including all of the vitamins except B7 and K (in the NDS15). And which minerals are utilized ranges from just calcium and iron (in the NQI, NRF6, and NDS5) all the way to calcium, iron, zinc, magnesium, copper, iodine, and selenium (in the NDS23). For the NRF and NDS, multiple variations were created, incorporating anywhere from 5 to 23 nutrients into their calculations (hence the number after the acronym; for example, NDS5 uses 5 nutrients and NRF23 uses 23 nutrients) and either with or without penalizing foods for their sodium, added sugars and saturated fat content (in which case, the acronym has a “.3” added at the end, for example the NRF15.3 includes 15 nutrients in its calculation and penalizes for 3). None of these scores incorporate phytonutrients into their calculations (which is sad given how valuable they are, see The Amazing World of Plant Phytochemicals and Polyphenols: Magic Bullet or Health Hype?).
Nutrivore Weekly Serving Matrix
An easy-to-use and flexible weekly checklist
to help you maximize nutrient-density.
The Weekly Serving Matrix is very helpful! I’ve been eating along these lines but this really helps me know where to focus vs. which foods serve a more secondary role. It’s super helpful and has taken a lot of worry out of my meal planning. Thanks!
Jan
In fact, there has been much discussion among scientists over which nutrients to include in nutrient profiling calculations. This concern originates from the fact that certain nutrients are more strongly correlated with health outcomes than others (typically those that we’re most likely to be deficient in rather than the nutrient itself being less important), such as high consumption of omega-3 fats, fiber and vitamin D. To attempt to hone in on the best sampling of nutrients to include in a nutrient-density score, a couple of studies have compared the NRF calculated with 5 to 16 nutrients (with or without limits for sodium, sugars and saturated fats, and with our without weighting for various food groups) to the Healthy Eating Index (HEI). The HEI is a way to quantify compliance with the USDA dietary guidelines, by assigning an energy adjusted score for servings from 9 food groups or nutrients to encourage (total fruits, whole fruits, total vegetables, greens and beans, whole grains, dairy, total protein foods, seafood and plant protein, and fatty acids ratio) and subtracting servings from 4 food groups or nutrients to discourage (refined grains, sodium, added sugars, and saturated fat). Interestingly, these studies found that an NRF with fewer nutrients in the calculation better aligned with the HEI, with 9 nutrients (protein, fiber, vitamin A, vitamin C, vitamin E, calcium, iron, magnesium and potassium) being optimal.
But, here’s where this line of reasoning is fundamentally flawed. Why would we retrofit a nutrient density score to align with dietary guidelines that were crafted without nutrient density or nutrient sufficiency in mind? This especially makes no sense when you consider that there is also little understanding of how individual nutrient-dense foods fit into healthful dietary patterns. As discussed in Essential Nutrient Deficiency and Autoimmune Disease, Natural Approaches to Cold & Flu Season (and Covid-19!), The Importance of Nutrient Density and Introduction to Nutritional Sciences, the prevalence of nutrient deficiencies is extremely high, even when people follow the USDA dietary guidelines, and these deficiencies increase risk of chronic and infectious disease. To advance the public’s understanding of what constitutes a nutrient-dense food, nutrient profiling must necessarily be algorithmically independent from the Healthy Eating Index and USDA dietary guidelines. Only then can we use nutrient profiling to improve dietary guidelines. And, the fact that the NRF calculation that best aligns with the HEI is the one that uses only nine nutrients reveals that following the USDA dietary guidelines will not result in nutrient sufficiency.
How Nutrient Profiling Could Inform Dietary Guidelines
It makes vastly more sense to devise a nutrient profiling method that simply reflects the nutritive value of a food, and then to study how eating more nutrient-dense foods impacts disease risk. In fact, there was a 2104 study of people over the age of 55 that showed that the higher the NRF9 of their diet as a whole, the lower their risk of all-cause mortality—the highest NRF9 quartile had a 16% lower chance of dying than the lowest NRF9 quartile. This study helps to prove that potentially huge health benefit of a diet replete with nutrient-dense foods, but more studies like this that incorporate even more nutrients into the calculus are necessary to advance this field of research.
To illustrate how important it is to take a comprehensive approach to nutrient profiling, take a look at how ten whole foods rank, when using 9, 15, 20 or 33 nutrients to quantify their nutrient density (in the NRF9, NRF15, NRF20 and Nutrivore Score, respectively). The more nutrients that are included in a calculation, when following the NRF model which does not cap a nutrient at 100% DV, the higher the score can be—that’s why every food has a higher score when more nutrients are taken into account. However, look not only at the order of the foods, and how including more nutrients provides a more complete picture of how nutrient-dense a food is, but also the spread between the scores. The more nutrients used in the calculus, the easier it is to differentiate between the most nutrient-dense foods and the least. Given what a nutrient powerhouse liver is, it just makes sense that its score would be vastly higher than, say, chicken breast.
| NRF9 | NRF15 | NRF20 | Nutrivore Score | |
| 1. | Spinach – 895 | Beef liver – 2605 | Beef liver – 2668 | Spinach – 4548 |
| 2. | Beef liver – 553 | Spinach – 1338 | Spinach – 1521 | Kale – 4233 |
| 3. | Kale – 530 | Oysters – 1137 | Oysters – 1490 | Beef liver – 4021 |
| 4. | Broccoli – 501 | Kale – 674 | Kale – 770 | Broccoli – 2833 |
| 5. | Salmon – 187 | Broccoli – 633 | Broccoli – 697 | Oysters – 2255 |
| 6. | Sweet potato – 163 | Salmon – 323 | Salmon – 694 | Salmon – 868 |
| 7. | Oysters – 112 | Sweet potato – 253 | Sweet potato – 278 | Sweet potato – 379 |
| 8. | Chicken breast – 82 | Avocado – 125 | Chicken breast – 172 | Blueberries – 396 |
| 9. | Blueberries – 64 | Chicken breast – 112 | Avocado – 155 | Chicken breast – 309 |
| 10. | Avocado – 59 | Blueberries – 125 | Blueberries – 155 | Avocado – 251 |
The above table also helps to illustrate how a single nutrient can dramatically shift the nutrient profiling score of a specific food. For example, zinc is not included in the NRF9 but is included in the other scores. Oysters are the top food source of zinc, insufficiency of which affects an estimated 73% of Americans in large part because zinc-rich foods are few and far between and those that are, like oysters, are not a common food on the Standard American Diet. In fact, a single serving of oysters contains 174% DV of zinc! As soon as zinc is added to the score, oysters rank much more highly, which makes sense since they’re such a valuable source of vitamins, minerals and healthy fats while being an invaluable source of zinc!
The insight gleaned from nutrient profiling is profound. It emphasizes the value of certain families of plant foods (especially cruciferous vegetables, mushrooms, leafy greens, and fresh herbs) while also elevating the value of fish, shellfish and organ meat. At the same time, it emphasizes the high caloric density and low nutrient density of grains and dairy products. This information would be super useful were it incorporated into the USDA dietary guidelines, helping people to identify the most nutritious foods to eat!
The Problem with Penalizing, Capping and Emphasizing
Some scores penalize for the presence of nutrients whose excess consumption have been (even loosely) linked to health problems, like sodium, saturated fat, added sugars, and cholesterol.
As I discussed in detail in Eggs: Nutritious Protein or Cholesterol Bomb?, dietary cholesterol does not increase serum lipids for most people and is the backbone of vitamin D and other steroid hormones. Dietary saturated fat is only problematic when intake exceeds about 15% of total calories (although this does depend on genetic predisposition, see Saturated Fat: Healthful, Harmful, or Somewhere In Between? and Genes to Know About: ApoE). Sodium is only problematic when intake exceeds about 7 grams per day, and there are studies showing that even this level is only worrisome when potassium intake is concomitantly low, see Is Salt Paleo?. Added sugars become problematic above about 10% of total calories (and 25% of total carbohydrates), see How Does Sugar Fit into a Healthy Diet? and TWV Podcast Episode 467: Can Eating Sugar Daily Be Healthy?. Most importantly, all of these nutrients are healthy in moderate amounts, and only unhealthy when the whole diet includes excess. And, all of these potentially problematic nutrients are abundant in fast food, junk food and other hyperpalatable manufactured foods that are also low in essential nutrients and very high in calories—this is why scores that penalize for these nutrients give these types of foods scores less than zero!
Penalizing individual foods for the presence of these nutrients does not reflect the diet as a whole, and has the capacity to undervalue otherwise nutrient-dense whole foods which can fit into a health-promoting diet, while not being necessary to show that fast food and junk food are unhealthy (they’re nutritionally void enough to already have low scores!).
Some of these scores (like the NDS) cap a nutrient’s contribution at 100% DV, whereas others recognize that a food having more than a 100% DV of a specific nutrient per serving makes that food a very valuable source of that nutrient! There’s no such thing as a nutritionally complete food, so the goal is nutrient sufficiency of the entire diet, not of any one particular food. Thus, it’s important to understand how to combine foods that are good sources of different nutrients in order to achieve dietary nutrient sufficiency. Capping a nutrient’s contribution to the nutrient density score at 100% hinders our ability to understand the importance of food combining for nutrient sufficiency. For example, Brazil nuts are the most nutrient-dense nut attributable to their very high selenium content—a 1-ounce serving delivers nearly 1000% DV of selenium! But, if you capped the contribution of selenium to the calculation of Brazil nut nutrient density, they would erroneously appear to be one of the lowest nutrient-density nuts. It just makes sense to fully value the awesome selenium content of Brazil nuts and have that reflected in its nutrient density score!
Another topic for discussion is whether to weight certain nutrients more in nutrient profiling.
It makes sense on the surface to count those nutrients for which a larger proportion of the population are deficient more than those nutrients for which very few people are deficient. But, here’s the challenge with that logic: the potential for overcorrection and simply shifting towards different common nutrient deficiencies. If those foods that are particularly good sources of the nutrients that, for example, an estimated 70% or more of Americans routinely don’t consume enough of (vitamin B9, vitamin D, vitamin E, choline, calcium, potassium, zinc, omega-3 fats, and polyphenols) had inflated scores as a result of weighting these nutrients more heavily in nutrient profiling, food sources of other nutrients end up being undervalued. This approach has the capacity to shift food choices in a way that could help address some population level nutrient deficiencies over the short term, but that’s not the same thing as moving towards nutrient sufficiency, especially over the long term.
When we look at nutrient profiling methods described in the scientific literature, it becomes abundantly clear that a nutrient-density score best describes a food when it includes as many nutrients as possible, when the contribution of nutrients are not capped at 100% DV, when they are presented relative to calories, when they are not weighted by food groups, and when they are not normalized to a fixed scale.
Consumer-Focused Nutrient Profiling
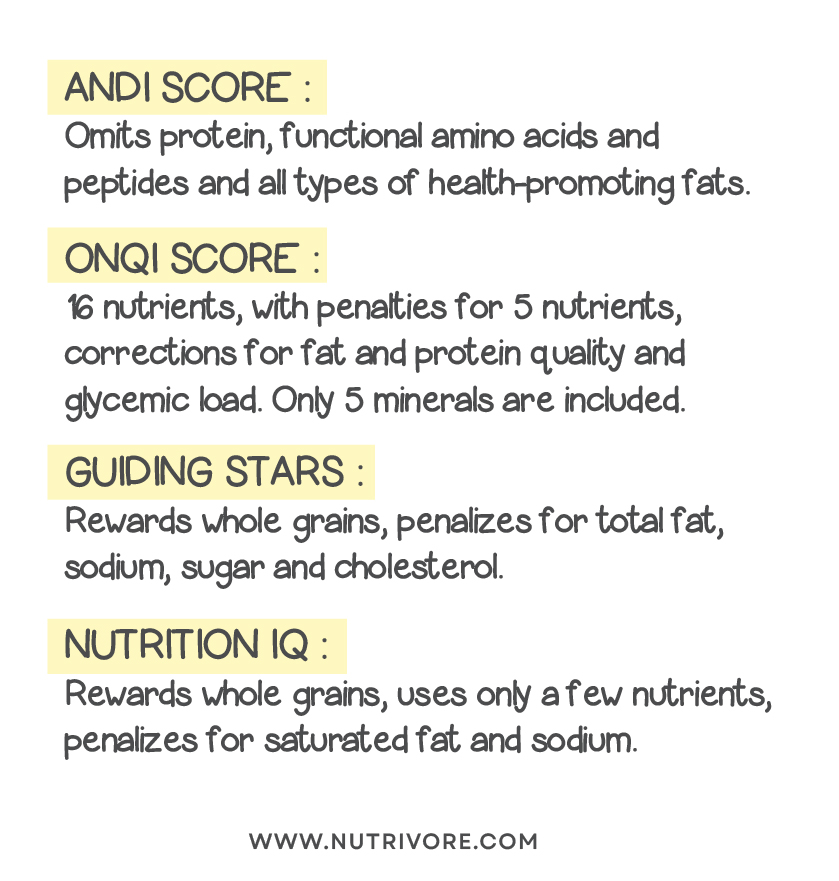
Several other nutrient profiling methods have been devised by non-researchers with the goal of educating consumers, such as the ANDI Score, NuVal (based on ONQI), Guiding Stars, and Nutrition IQ.
The ANDI score may be one of the most comprehensive nutrient profiling systems, but the score overemphasizes nutrients inherent to plant foods while deemphasizing nutrients inherent to animal foods, creating a biased result. For example, the ANDI score incorporates separately into its calculation: beta carotene, alpha carotene, lycopene, lutein and zeaxanthin (all carotenoids); fiber and resistant starch (both fiber); glucosinolates and organosulfides (both organosulfur compounds); phytosterols, angiogenesis inhibitors, aromatase inhibitors, resveratrol and ORAC score (most plant phytonutrients are antioxidants as are vitamin C and E). On the other hand, the score omits protein, functional amino acids and peptides (like anserine, creatine, carnosine, carnitine, and taurine) and all types of health-promoting fats (like omega-3s, monounsaturated fats, CLA and MCTs).
The ONQI is calculated based on 16 nutrients, with penalties for 5 nutrients and corrections for fat and protein quality and for glycemic load. Most notably, only 5 minerals are included, only three of the B vitamins are included, and only two types of phytonutrients (flavonoids and carotenoids) are included, while vitamin K and choline are excluded. In addition, because both cholesterol and saturated fat are penalized (despite the fact that whether these are problematic is entirely context-dependent), animal foods are penalized unnecessarily.
The Guiding Stars system rewards whole grains (despite their low nutrient-density compared to vegetables, fruits, legumes, nuts and seeds), and penalizes for total fat, sodium, sugar and cholesterol And, the Nutrition IQ system also rewards whole grains, uses only a few nutrients in its determination, and also penalizes for saturated fat and sodium. The net result for both of these scores is to overemphasize grains, which are not nutrient-dense by any objective measure, and deemphasize animal foods.
The Problem of Incomplete Data
There’s one final challenge to nutrient profiling: incomplete data.
The United States Department of Agriculture maintains arguably the most comprehensive nutrient database in the world, called Food Central, with expanded nutrient data compiled for over 7,000 basic foods and partial nutrient data (at least what is required on food label) for nearly 360,000 different branded foods. But, even this amazing database is missing some key information. Many of the main entries are missing measurements for some nutrients (commonly vitamin D, vitamin B5, manganese, vitamin K2, and phytosterols) and certain nutrients aren’t included in the database at all (including vitamin B7, iodine, polyphenols, CoQ10, and other functional compounds, including most phytonutrients). Fiber is not differentiated between soluble and insoluble, and the method used to measure fiber is known to undercount resistant starch and oligosaccharides.
In addition, the entries generally provide average measurements for common quality food products, so it’s not possible to differentiate the nutrient content of higher quality options. And, while many of these gaps can be filled in from measurements presented in scientific studies, it’s surprising to discover how incomplete human knowledge is about the nutrient content of common foods.
There’s really no good solution, other than to scour the scientific literature and other databases for as many nutrients as possible missing from the USDA Food Central database (which my team and I are doing), label when a nutrient-density score is calculated based on incomplete data, and advocate for continued measurements of the nutrient content of foods.
How the Nutrivore Score Is Calculated
The Nutrivore Score is currently the most comprehensive, and least bias, method for representing the inherent nutrient content of foods, borne out of a confusing array of similar, yet all flawed, nutrient density scores, while recognizing the current limitations posed by incomplete data.
The Nutrivore Score is calculated based on 32+1 nutrients. The 32 primary nutrients that go into the score are:
- Protein
- Fiber
- Calcium
- Copper
- Iron
- Magnesium
- Manganese
- Phosphorus
- Potassium
- Selenium
- Zinc
- Vitamin A
- Vitamin B1
- Vitamin B2
- Vitamin B3
- Vitamin B5
- Vitamin B6
- Vitamin B7
- Vitamin B9
- Vitamin B12
- Vitamin C
- Vitamin E
- Vitamin D
- Vitamin K
- Choline
- Monounsaturated fat
- Linoleic acid
- ALA
- EPA+DHA
- Carotenoids
- Phytosterols
- Polyphenols
The score is calculated as the sum of each nutrient relative to its RDA or AI present in 100 grams of the food, divided by the amount of calories per 100 grams. Data that’s not included in the Food Central Database are obtained from scientific papers and other databases like Phenol Explorer whenever possible. When multiple papers report the amount of a nutrient for a particular food, the highest value is utilized, unless there’s a clear methodological advantage to one specific measurement, and provided it is no more than one standard deviation from the mean of all available data (in which case, the second highest value is utilized following the same statistical test). Also, periodically two entries from the Food Data Central database are amalgamated to calculate the Nutrivore Score when two highly-related foods (for example, sockeye salmon and Coho salmon) have incomplete data. This is noted wherever it’s the case.
Further, the Nutrivore Score adds the highest value of available data for one bonus nutrient (that’s the +1), relative to a threshold set using epidemiological studies for that nutrient, similar to a %DV. The bonus nutrient currently can be any of: glucosinolates (the precursor for isothiocyanates and indoles), thiosulfinates, CoQ10, CLA, betaine, betalains, myo-inositol, ergothioneine, taurine and medium-chain triglycerides. The reason why only one bonus nutrient is included in the Nutrivore Score is because incomplete data would mean less common or understudied foods are unnecessarily penalized. Where the level of multiple nutrients in a food remain unknown, the Nutrivore Score is marked with an asterisk to denote that the score is likely underestimated for that food and should be thought of as a minimum.
The Nutrivore Score is not corrected for nutrient bioavailability, nutrient absorption capacity, or metabolic conversion inefficiencies. It’s true that specific isoforms of nutrients are more easily absorbed and/or used by the body. For example, while vitamin K1 accounts for approximate 90% of the total vitamin K in the diet, only 10 to 15% of it is absorbed in the digestive tract, the net effect being that vitamin K1 accounts for about half of the total absorbed vitamin K, whereas vitamin K2 is highly absorbable and represents the remaining 50% (see TWV Podcast Episode 417: Vitamin K2, Hype, or Essential?). While vitamin K isoform data is available for some foods in the USDA Food Central database, as a general rule, nutrient isoform data is rarely available, making correcting for absorption or utilization efficiency of different nutrient forms impossible. It’s also true that certain combinations of nutrients can either enhance or hinder absorption. For example, vitamin C can increase iron absorption, fats can increase carotenoid and vitamin K absorption, but zinc and copper compete for absorption as do calcium and magnesium. However, this can’t be accounted for in a nutrient density score for an individual food because all nutrients present in an entire meal interact. And sometimes, absorption is influenced by factors independent of food. For example, vitamin D status influences calcium absorption; a functioning gallbladder is necessary for efficient fat and fat-soluble vitamin absorption; and while folic acid is much more readily absorbed in the digestive tract than the active form of vitamin B9, L-methylfolate, those with MTHFR gene variants can’t covert folic acid efficiently (see Paleo for Pregnancy and Lactation and Genes to Know About: MTHFR). So, because nutrient absorption competition or facilitation goes beyond an individual food and is instead related to all of the foods consumed at a meal as well as other factors such as genetics, it makes no sense to correct for these in a nutrient profiling method. The Nutrivore Score also does not incorporate a satiety index, again because satiety is related to macronutrient and water combinations from an entire meal rather than an individual food.
Rather than penalizing for the presence of nutrients whose excess is associated with health problems (like saturated fats, sodium and sugars), these nutrients are simply not included in the Nutrivore Score calculation. It is helpful to note that foods high in fats and sugars have a higher energy density, meaning more calories per gram or per serving of food, which does lower the Nutrivore Score. In addition, the presence of antinutrients such as phytates or oxalates are not taken into account. This is because the impact of antinutrients on nutrient absorption is also extremely context dependent. For example, our gut bacteria can liberate a substantial amount of the calcium, magnesium, iron, potassium and zinc bound to phytates for us, thereby releasing the bound minerals as well as phosphorus and thereby enhancing their bioavailability. A healthy, diverse gut microbiome can typically degrade about half (about 500 to 600 mg daily) of the phytate consumed in the average American diet. Other factors influencing bioavailability include health of the gastrointestinal tracts, nutrient status, competitive binding with other nutrients, meal composition, various drugs and supplements, time of day and biorhythms, age and gender. It doesn’t make sense to try to reflect nutrient digestibility and absorption in the Nutrivore Score when the system is so complex and varies from individual to individual.
You can think of the Nutrivore Score as a simple yet comprehensive representation of the inherent nutrients within a food, and acknowledge that a variety of factors will determine whether or not your body absorbs and uses all of those nutrients.
Because nutrients can be lost, formed and transformed by cooking, the Nutrivore Score is calculated based on the nutrients within the raw whole food, unless noted otherwise. Also, it is unusual for there to be nutrient data for different quality levels of a food. For example, the Food Central database contains only one entry for olive oil, but research has shown that the polyphenol content of virgin olive oil can range from anywhere between 50 to 5000 mg/kg, and the vitamin E content can range from 100 to over 1000 mg/kg. Another example: even though locally-grown, in-season organic vegetables and fruit and known to have higher nutrient density (due to being grown in higher quality soil, picked ripe, and eaten much sooner after harvest), there are no separate entries in the Food Central database for organic versus conventionally-grown produce. For this reason, we can think of Nutrivore Scores as a minimum or average value and feel confident that the effort to seek out higher quality options (grass-fed meat, wild-caught fish, fresh cold-pressed extra-virgin olive oil, and local in-season vegetables and fruit) is still nutritionally valuable if currently not quantifiable.
As more nutrient data become available, the Nutrivore Score will be updated to reflect more complete nutritional information. This obviously applies to missing nutrition information from the Food Central database, but there’s also the likelihood of adding nutrients to the Nutrivore Score calculation in the future. For example, a protein digestibility score, soluble versus insoluble fiber, trace minerals, functional nonproteinogenic amino acids and peptides, functional fatty acids, and vitamin-like compounds that aren’t currently utilized to calculate the Nutrivore Score could all be added once there is sufficient data to rationalize their inclusion. For now, extremely sparse data makes this prohibitive, and similarly would reward foods simply for being better studied, not necessarily for inherently higher nutritional value, relative to less common foods.
Using the Nutrivore Score
It is time for a positive approach to dietary guidance using nutrient density as a basic principle. The Nutrivore Score is a necessary foundational step towards achieving this goal! By understanding the nutrients per calorie offered by individual foods via the Nutrivore Score, in addition to recognition that certain nutrients are exclusive to specific food groups, we can achieve nutrient sufficiency by choose a variety of nutrient-dense superfoods as well as the highest Nutrivore Score options from the various foundational food groups.
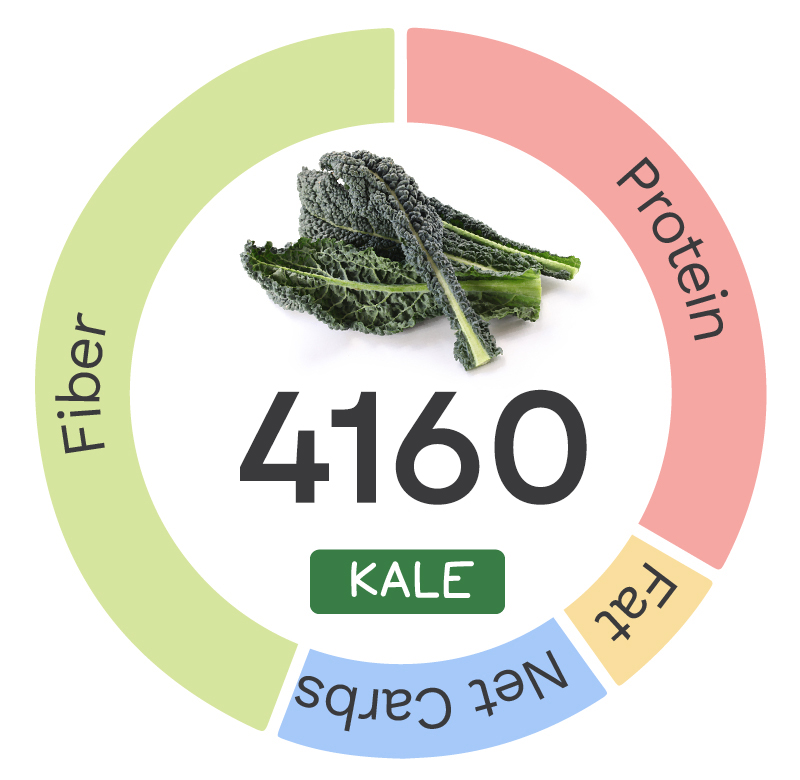
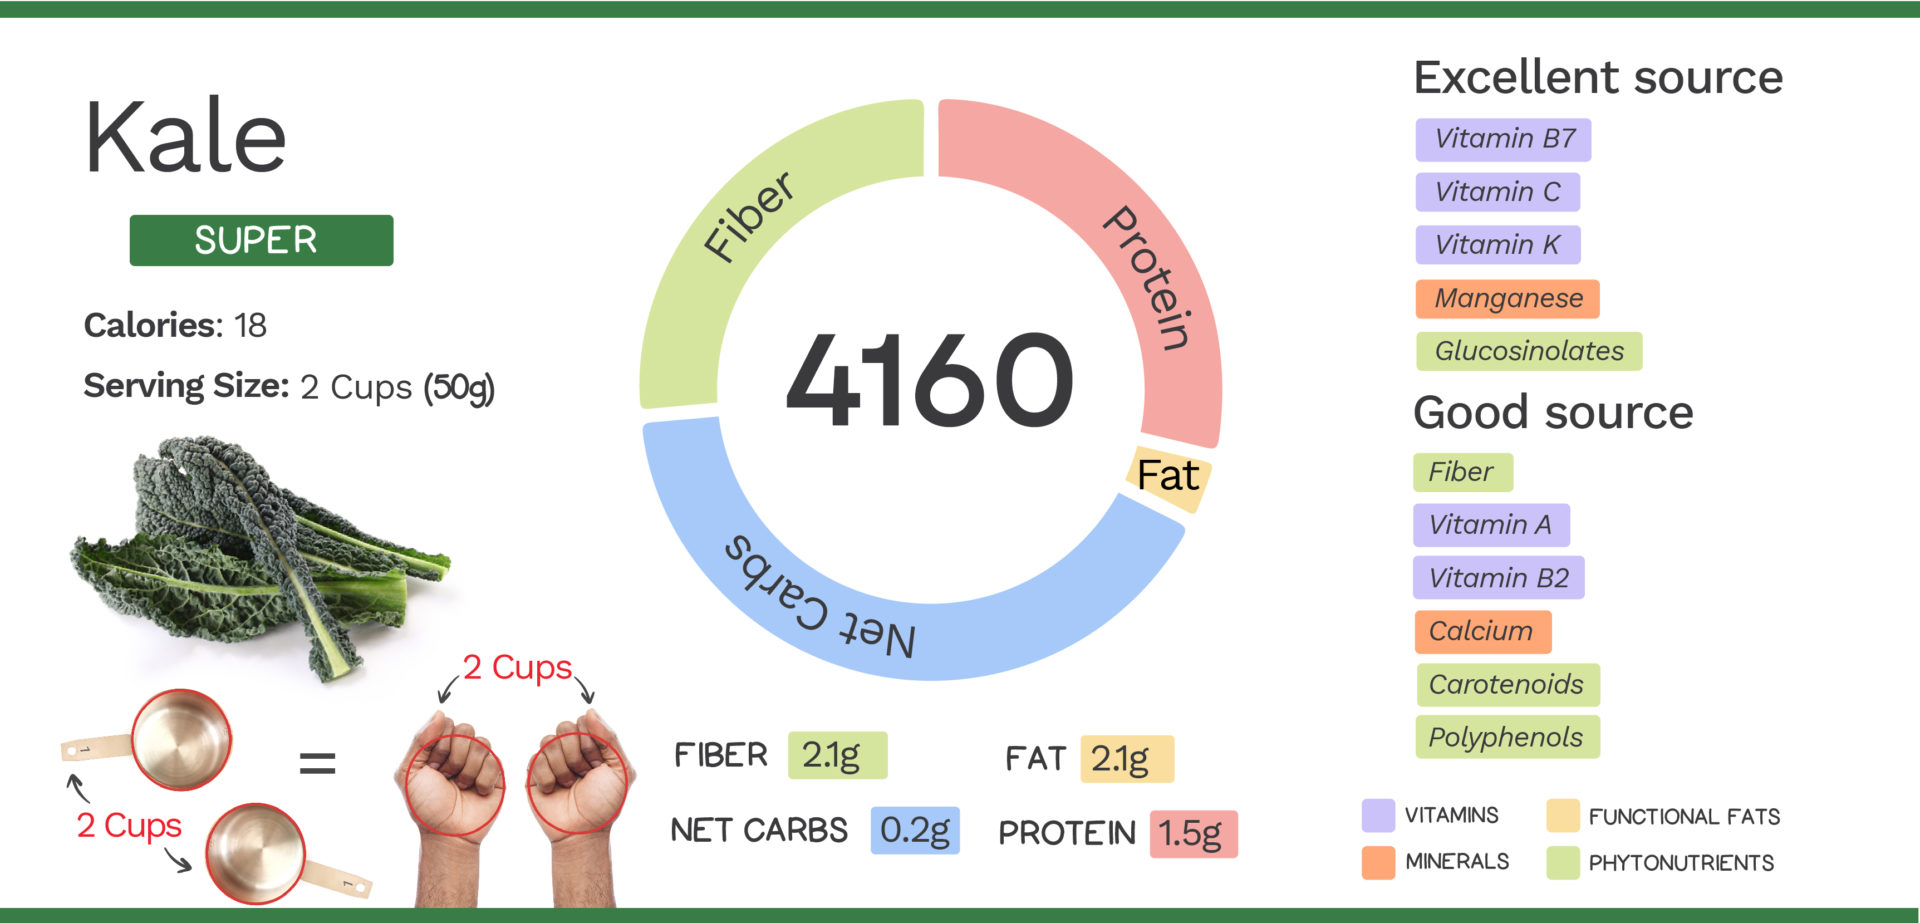
As I build Nutrivore.com, the Nutrivore Score is one of several tools that I am using to communicate which foods have the most to offer us. As you can see with the sample nutrient card above, I’m also highlighting the nutrients per serving (rather than only considering nutrients per calorie), including which are excellent sources (more than 20%DV) and which are good sources (10-20%DV). I’m combining this nutritional information with a review of the scientific literature on the specific health impacts of eating a food, and detailed information on what nutrients do in the body and how much of them we need. And, I’m creating educational resources on how to select various foods with complementary nutrition to achieve nutrient sufficiency!
I’m building this website outside of any dietary dogma. Being a Nutrivore is about the overall quality of the whole diet, and not about a list of yes-foods and no-foods. Even though eliminating empty calorie foods helps to achieve nutrient sufficiency without overeating, no food is strictly off-limits. In this way, being a Nutrivore is a diet modifier rather than a diet itself—a Nutrivore approach can be layered atop of other dietary structures and priorities in order to meet an individual’s specific health needs and goals.
I see Nutrivore as the natural extension of my science-grounded approach, and one that will allow me to both level up the depth of my resources for my long-time readers who love my science deep dives, but also meet people where they are and embrace the idea that even a small first step is worth celebrating. (See also What Is a Nutrivore?, Ditching Diet Dogma, My Personal Journey with the Autoimmune Protocol and My Personal Journey as a Blogger).
My vision for Nutrivore.com is extremely ambitious: A detailed educational resource devoid of dietary dogma and instead purely based on scientific studies and nutrient profiling to quantify nutrient density, all with the goal of helping people achieve dietary nutrient sufficiency (a.k.a. Nutrivore) through informed day-to-day choices.
The Nutrivore Score is a measure of much nutrients, relative to the daily value (DV), a food contains per calorie. A nutrient-dense powerhouse superfood is any food with a Nutrivore Score higher than 800. High nutrient-density foods have a Nutrivore Score between 400 and 800. Medium nutrient-density foods have a Nutrivore Score between 150 and 400. And, low nutrient-density empty-calorie foods have a nutrivore score less than 150. Remember, there are no yes-foods and no-foods on a Nutrivore approach, but instead what matters is whether the diet as a whole meets the body’s nutritional needs. Overall dietary nutrient sufficiency is easy to achieve by selecting a variety of the highest Nutrivore Score foods within each food category.
So far, I have calculated the Nutrivore Score of about over 7,500 different foods, and boy there have been some surprises! Did you know that golden kiwis are a little more nutrient-dense than green kiwis? Or that dark meat turkey is more nutrient-dense than light meat turkey? Or that maple syrup and molasses have a medium nutrient-density score and that molasses is more nutrient-dense than cheese or pears?! Or that Asian pears are the most nutrient-dense Rosaceae family fruit (the apple and stone fruit family). Or that blackberries, strawberries and raspberries are all more nutrient-dense than blueberries? You’ll be able to find all of this information in my new e-book, Guide to Nutrivore!
Introducing the Guide to Nutrivore E-Book!
Guide to Nutrivore lays the foundation for Nutrivore as a general health approach, a base dietary philosophy devoid of dogma, on top of which you can layer additional food focus or eliminations to meet individual needs. In this sense, being a Nutrivore is a diet modifier rather than a diet itself.
With this beautifully-designed e-book, you’ll:
- learn how a Nutrivore approach can improve health
- appreciate what essential and nonessential nutrients do in the body
- get practical tips on how to increase nutrient-density
- examine how to use the Nutrivore Score to choose healthier foods
- find detailed nutrition information on the Top 100 Nutrivore Score Foods
- compare the nutrient-density versus energy-density of food groups
- easily implement Nutrivore with handy-dandy visual guides and reference tables!
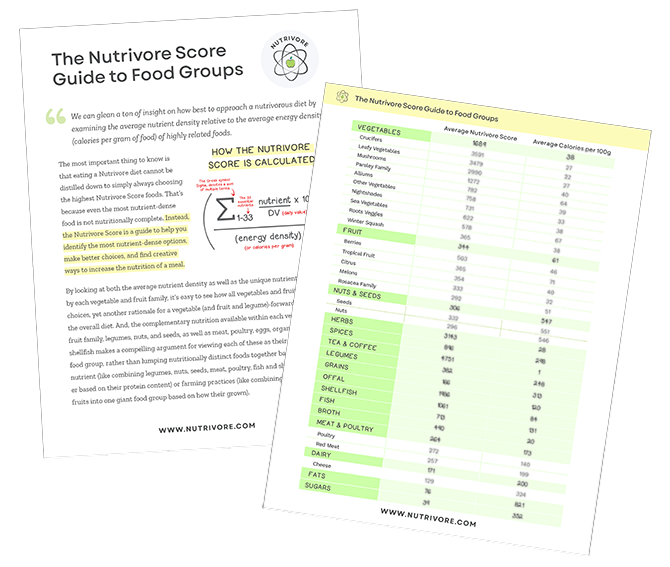
The Guide to Nutrivore explains how to eat a Nutrivore diet and introduces the Nutrivore Score, the most comprehensive and least-biased method to assess the nutritive value of individual foods. Detailed nutrition information for the Top 100 Nutrivore Score Foods is summarized with beautiful graphics for each food. And, the Guide to Nutrivore includes analysis of food groups, considerations when preparing Nutrivore meals, practical tips to increase the nutrient density of your diet, and a look-up table for the Nutrivore Score of approximately 300 foods.
Nutrivore Scores of Common Foods
And, while you wait for Guide to Nutrivore and Nutrivore.com, here’s the Nutrivore Scores of some common foods!
- Arugula – 2019
- Avocado – 251
- Beef Liver – 4021
- Bell Peppers, Red – 1358
- Blueberries – 396
- Brazil Nuts – 694
- Broccoli – 2833
- Butternut Squash – 670
- Cheddar Cheese – 126
- Chia – 450
- Chicken, Breast – 309
- Cremini Mushrooms – 2279
- Eggs – 355
- Garlic – 5622
- Green Leaf Lettuce – 2245
- Kale – 4233
- Mango – 342
- Oranges – 408
- Oysters – 2255
- Potato – 273
- Rice, White – 66
- Salmon, Wild Atlantic – 868
- Spinach – 4548
- Strawberries – 762
- Sugar, Granulated – 1
- Sweet Potato – 379
- Walnuts – 303
- Watercress – 6929
- Wheat Flour, All-Purpose – 70
- Yogurt, Greek, Whole – 178
Citations
Chiuve SE, Sampson L, Willett WC. The association between a nutritional quality index and risk of chronic disease. Am J Prev Med. 2011 May;40(5):505-13. doi: 10.1016/j.amepre.2010.11.022. PMID: 21496749; PMCID: PMC3100735.
Darmon N, Briend A, Drewnowski A. Energy-dense diets are associated with lower diet costs: a community study of French adults. Public Health Nutr. 2004 Feb;7(1):21-7. doi: 10.1079/phn2003512. PMID: 14972068.
Darmon N, Darmon M, Maillot M, Drewnowski A. A nutrient density standard for vegetables and fruits: nutrients per calorie and nutrients per unit cost. J Am Diet Assoc. 2005 Dec;105(12):1881-7. doi: 10.1016/j.jada.2005.09.005. PMID: 16321593.
Drewnowski A , Burton-Freeman B . A new category-specific nutrient rich food (NRF9f.3) score adds flavonoids to assess nutrient density of fruit. Food Funct. 2020 Jan 29;11(1):123-130. doi: 10.1039/c9fo02344e. PMID: 31938797.
Drewnowski A, Dwyer J, King JC, Weaver CM. A proposed nutrient density score that includes food groups and nutrients to better align with dietary guidance. Nutr Rev. 2019 Jun 1;77(6):404-416. doi: 10.1093/nutrit/nuz002. PMID: 31222368; PMCID: PMC6489166.
Drewnowski A, Fulgoni V 3rd. Nutrient profiling of foods: creating a nutrient-rich food index. Nutr Rev. 2008 Jan;66(1):23-39. doi: 10.1111/j.1753-4887.2007.00003.x. PMID: 18254882.
Drewnowski A, Fulgoni VL 3rd. Nutrient density: principles and evaluation tools. Am J Clin Nutr. 2014 May;99(5 Suppl):1223S-8S. doi: 10.3945/ajcn.113.073395. Epub 2014 Mar 19. PMID: 24646818.
Drewnowski A, Maillot M, Darmon N. Testing nutrient profile models in relation to energy density and energy cost. Eur J Clin Nutr. 2009 May;63(5):674-83. doi: 10.1038/ejcn.2008.16. Epub 2008 Feb 20. PMID: 18285808.
Drewnowski A, Smith J, Fulgoni VL 3rd. The New Hybrid Nutrient Density Score NRFh 4:3:3 Tested in Relation to Affordable Nutrient Density and Healthy Eating Index 2015: Analyses of NHANES Data 2013-16. Nutrients. 2021 May 20;13(5):1734. doi: 10.3390/nu13051734. PMID: 34065287; PMCID: PMC8160959.
Drewnowski A. Concept of a nutritious food: toward a nutrient density score. Am J Clin Nutr. 2005 Oct;82(4):721-32. doi: 10.1093/ajcn/82.4.721. PMID: 16210699.
Drewnowski A. Defining nutrient density: development and validation of the nutrient rich foods index. J Am Coll Nutr. 2009 Aug;28(4):421S-426S. doi: 10.1080/07315724.2009.10718106. PMID: 20368382.
Drewnowski A. The Nutrient Rich Foods Index helps to identify healthy, affordable foods. Am J Clin Nutr. 2010 Apr;91(4):1095S-1101S. doi: 10.3945/ajcn.2010.28450D. Epub 2010 Feb 24. PMID: 20181811.
Fernández-Ríos A, Laso J, Campos C, Ruiz-Salmón I, Hoehn D, Cristóbal J, Batlle-Bayer L, Bala A, Fullana-I-Palmer P, Puig R, Aldaco R, Margallo M. Towards a Water-Energy-Food (WEF) nexus index: A review of nutrient profile models as a fundamental pillar of food and nutrition security. Sci Total Environ. 2021 Oct 1;789:147936. doi: 10.1016/j.scitotenv.2021.147936. Epub 2021 May 21. PMID: 34082212.
Fulgoni VL 3rd, Keast DR, Drewnowski A. Development and validation of the nutrient-rich foods index: a tool to measure nutritional quality of foods. J Nutr. 2009 Aug;139(8):1549-54. doi: 10.3945/jn.108.101360. Epub 2009 Jun 23. PMID: 19549759.
Imai C, Takimoto H, Fudono A, Tarui I, Aoyama T, Yago S, Okamitsu M, Sasaki S, Mizutani S, Miyasaka N, Sato N. Application of the Nutrient-Rich Food Index 9.3 and the Dietary Inflammatory Index for Assessing Maternal Dietary Quality in Japan: A Single-Center Birth Cohort Study. Nutrients. 2021 Aug 19;13(8):2854. doi: 10.3390/nu13082854. PMID: 34445014; PMCID: PMC8400739.
Maillot M, Darmon N, Darmon M, Lafay L, Drewnowski A. Nutrient-dense food groups have high energy costs: an econometric approach to nutrient profiling. J Nutr. 2007 Jul;137(7):1815-20. doi: 10.1093/jn/137.7.1815. PMID: 17585036.
Miller GD, Drewnowski A, Fulgoni V, Heaney RP, King J, Kennedy E. It is time for a positive approach to dietary guidance using nutrient density as a basic principle. J Nutr. 2009 Jun;139(6):1198-202. doi: 10.3945/jn.108.100842. Epub 2009 Apr 1. PMID: 19339707.
Mobley AR, Kraemer D, Nicholls J. Putting the nutrient-rich foods index into practice. J Am Coll Nutr. 2009 Aug;28(4):427S-435S. doi: 10.1080/07315724.2009.10718107. PMID: 20368383.
Murakami K, Livingstone MBE, Fujiwara A, Sasaki S. Application of the Healthy Eating Index-2015 and the Nutrient-Rich Food Index 9.3 for assessing overall diet quality in the Japanese context: Different nutritional concerns from the US. PLoS One. 2020 Jan 30;15(1):e0228318. doi: 10.1371/journal.pone.0228318. PMID: 31999772; PMCID: PMC6992222.
Murakami K, Livingstone MBE, Fujiwara A, Sasaki S. Reproducibility and Relative Validity of the Healthy Eating Index-2015 and Nutrient-Rich Food Index 9.3 Estimated by Comprehensive and Brief Diet History Questionnaires in Japanese Adults. Nutrients. 2019 Oct 21;11(10):2540. doi: 10.3390/nu11102540. PMID: 31640242; PMCID: PMC6836176.
Streppel MT, Sluik D, van Yperen JF, Geelen A, Hofman A, Franco OH, Witteman JC, Feskens EJ. Nutrient-rich foods, cardiovascular diseases and all-cause mortality: the Rotterdam study. Eur J Clin Nutr. 2014 Jun;68(6):741-7. doi: 10.1038/ejcn.2014.35. Epub 2014 Mar 19. PMID: 24642783.

